Excel Tool for Milestone Trend Analysis
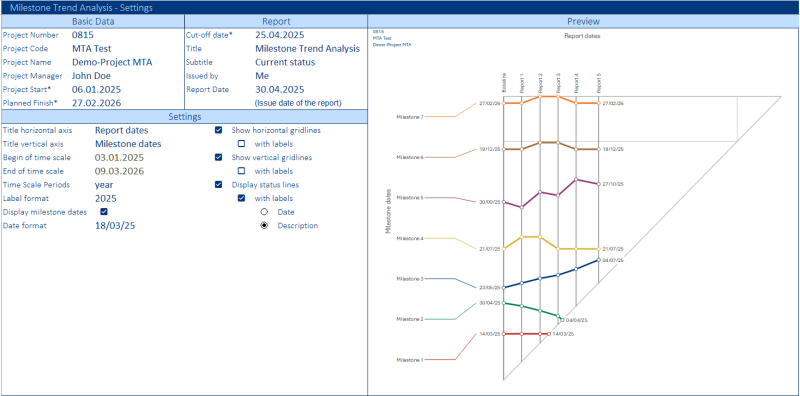
This Excel-based milestone trend analysis is an efficient graphical tool for tracking project milestones. It visualizes the trend of milestones and makes it possible to identify the resulting effects on the project completion date so that countermeasures can be taken in good time if necessary.
Due to its high information density and clarity, it is suitable for reports to the higher decision-making level. As it records the development of milestones, it can provide evidence for extensive detailed analyses at the end of the project (lessons learned).
An essential prerequisite is the careful definition of suitable project milestones with objectives, target dates and responsibilities at the start of the project. Up to 20 milestones can be recorded and tracked in this template.
During the project, the milestones are regularly assessed (usually in project meetings) and a forecast is made for their completion dates. These forecast dates or - once the milestones have been completed - the actual dates are recorded. The template is set up for up to 60 reporting dates.
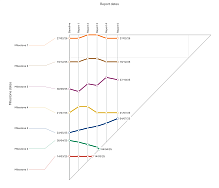
At the same time as the data is entered, the tool automatically creates an MTA diagram and a short report that are optimized for printing in A4 format. You can copy the automatically generated MTA diagram into self-created reports (Excel, Word, PowerPoint, etc.) as a graphic.
The user interface is multilingual. English and German are pre-installed. Three additional languages can be added by the user by editing the integrated translation table.
On a separate sheet, the template contains a detailed explanation of how to interpret MTA diagrams.
Features:
- Up to 20 milestones can be recorded
- A maximum of 60 reporting periods are available for tracking
- Intuitive to use and largely robust against incorrect entries (error messages for typical input errors)
- Subsequent addition of milestones not originally planned is possible
- Focus on the essentials possible by showing and hiding individual milestones
- Multilingual user interface: German and English installed, the user can define three more
The template was created for Microsoft 365 (Excel version 2408 or higher) and does not contain any VBA/macro code. Some functions are not available in the browser view (Excel for the web). The template may not be compatible with MAC.
Weitere Produktbilder:
|
Bitte beachten Sie: Alle Vorlagen wurden durch unsere Fachredaktion sorgfältig überprüft. Wir können jedoch keinerlei Haftung oder Garantie für die individuelle Nutzung dieser Vorlagen übernehmen (siehe AGB).
Anzeige
Neueste Stellenangebote
Sie möchten über neu eingehende Stellenangebote automatisch informiert werden? Dann können Sie unseren kostenfreien Jobletter abonnieren. Mit diesem erhalten Sie alle 14 Tage die aktuellsten Stellenanzeigen und weitere Arbeitsmarkt-News. Jobletter jetzt abonnieren >> Sie haben eine Frage?

Nutzen Sie kostenfrei das Forum für E-Commerce-Fachwirte und und diskutieren ihre Fragen zu Controlling-Themen.
Sie möchten sich weiterbilden?

In unserer Seminar-Rubrik haben wir einige aktuelle Seminar- und Kurs-Angebote für E-Commerce-Fachkräfte, u.a. auch Kurse zum E-Commerce Fachwirt / IHK zusammengestellt.
News
Community

Nutzen Sie kostenfrei das E-Commerce1x1.de Forum und tauschen sich mit den Kollegen aus bzw. holen sich Rat für Ihre Karriere im E-Commerce-Bereich.
Talentpool - Jobwechsel einfach!

Tragen Sie sich kostenfrei im Talentpool auf E-Commerce1x1.de ein und erhalten Jobangebote und Unterstützung beim Jobwechsel durch qualifizierte Personalagenturen.
Anzeige
Buch-Vorstellungen
Kennzahlen-Guide
 Über 200 Kennzahlen aus Finanzen, Personal, Logistik, Produktion, Einkauf, Vertrieb, eCommerce und IT.
Jede Kennzahl wird in diesem Buch ausführlich erläutert. Neben der Formel wird eine Beispielrechnung aufgeführt. Für viele branchenneutrale Kennzahlen stehen Zielwerte bzw. Orientierungshilfen für eine Bewertung zur Verfügung. Für die genannten Bereiche hat die Redaktion von Controlling-Portal.de jeweils spezialisierte Experten als Autoren gewonnen, die auf dem jeweiligen Gebiet über umfangreiche Praxiserfahrung verfügen.
Preis: ab 12,90 Euro Brutto mehr Informationen >>
Dashboards mit Excel
 Wie erstelle ich ein Tacho- oder Ampel-Diagramm? Wie kann ich Abweichungen in Tabellen ansprechend visualisieren? Das wird Ihnen hier anschaulich erklärt.
 Taschenbuch in Farbe für 34,90 EUR
oder E-Book für 12,90 EUR
mehr Informationen >>
Reporting 1x1
 Viel ist zum Berichtswesen oder Reporting schon geschrieben worden. Dennoch zeigen Umfragen, dass rund 50 Prozent der Empfänger von Berichten mit dem Reporting nicht zufrieden sind. Jörgen Erichsen erklärt in diesem Buch die Bedeutung und die Handhabung des Berichtswesens speziell für kleinere Betriebe. Mit zahlreichen Beschreibungen, Beispielen und Checklisten.
Taschenbuch in Farbe für 24,90 EUR
oder E-Book für 15,90 EUR
mehr Informationen >>
Anzeige
 Ihr Stellenangebot auf E-Commerce1x1.de: Erreichen Sie mit Ihrem Stellenangebot zu einem vergleichsweise sehr günstigen Preis (ab 300,00 €) und ohne große Streuverluste zielgerichtet praxisbewährte Buchhalter, Steuerfachangestellte oder Bilanzbuchhalter. Jobangebot einstellen >>
 Anzeige
Premium-Mitgliedschaft
Erhalten Sie als StudentIn oder Auszubildene(r) Zugriff auf Premium-Inhalte von Controlling-Portal.de und Rechnungswesen-Portal.de zum Vorzugspreis von 39,- EUR für 2 Jahre. Aktuelle und ständig erweiterte Fachbeiträge, ausgewählte sonst kostenpflichtige Excel-Vorlagen. Verschaffen Sie sich hier einen Überblick über unsere Premium-Inhalte.Weitere Informationen zum Ausbildungspaket >>
Anzeige
Anzeige
Stellenmarkt
Mitarbeiter (m/w/d) Unternehmensentwicklung und Controlling Das Waisenhaus – Stiftung des öffentlichen Rechts – ist eine seit 1679 bestehende Frankfurter Stiftung. Wir sind eine Einrichtung der ambulanten, teilstationären und stationären Jugendhilfe. Unser Ziel ist es, die Lebensperspektive von Kindern und Jugendlichen in der heutigen Gesellschaft zu ve... Mehr Infos >>
Referent Anlagenbuchhaltung / Bilanzierung (m/w/d)
 ONTRAS betreibt 7.700 Kilometer Fernleitungsnetz in Ostdeutschland. Wir transportieren Erdgas und grüne Gase zu unseren Kunden, den nachgelagerten Netzbetreibern wie Stadtwerken und Industriekunden. Über 458 Mitarbeiter*innen bringen ihr Know-how am Leipziger Hauptsitz und an 12 weiteren Standort... Mehr Infos >>
Mitarbeiter in der Finanzbuchhaltung (m/w/d)
 Die WIRTGEN GROUP ist ein international tätiger Unternehmensverbund der Baumaschinenindustrie. Zu ihm gehören die traditionsreichen Produktmarken WIRTGEN, VÖGELE, HAMM, KLEEMANN und BENNINGHOVEN mit ihren Stammwerken in Deutschland sowie lokale Produktionsstätten in Brasilien, China und Indien. B... Mehr Infos >>
Weitere Stellenanzeigen im Stellenmarkt >>

eBook: Controlling mit Chat GPT
Dieses Buch zeigt praxisnah, wie Sie ChatGPT effektiv in Ihren Controlling-Alltag integrieren können. Von der Erstellung intelligenter Prompts bis hin zur Automatisierung von Controlling-Prozessen – Sie erhalten das Wissen und die Werkzeuge, um Ihre Arbeit auf das nächste Level zu heben.Jetzt hier für 9,99 EUR downloaden >>
Nützliche Excel-Tools

Personalkostenplanung mit Kurzarbeit
Das Excel-Tool „Personalkostenplanung“ ermöglicht eine branchenunabhängige Personalkostenplanung auf monatlicher Basis für bis zu 50 Mitarbeiter für maximal 3 Jahre. Die maximale Anzahl der Mitarbeiter sowie der Planungshorizont lassen sich einfach erweitern. mehr Infos >>
Excel-Rechnungsgenerator
Der „Rechnungsgenerator“ ist ein professionelles Excel-Tool zur einfachen, automatisierten Erstellung von Angeboten, Rechnungen und Lieferscheinen. Damit lassen sich rechtskonforme Rechnungen für in- und ausländische Unternehmens- oder Privatkunden... mehr Infos >>
Weitere Excel-Vorlagen finden Sie hier >>

Personalkostenplanung mit Kurzarbeit
Das Excel-Tool „Personalkostenplanung“ ermöglicht eine branchenunabhängige Personalkostenplanung auf monatlicher Basis für bis zu 50 Mitarbeiter für maximal 3 Jahre. Die maximale Anzahl der Mitarbeiter sowie der Planungshorizont lassen sich einfach erweitern. mehr Infos >>
Arbeitszeiterfassung und Tätigkeitsnachweis
Arbeitszeiten erfassen und Tätigkeitsnachweise erstellen Professionelle, branchenübergreifende Excel-Vorlage für die Erfassung von Arbeitszeiten bzw. die Erstellung von Tätigkeitsnachweisen. Die Vorlage eignet sich besonders für kleine und mittlere Unternehmen (KMU), aber auch für Freiberufler, Freelancer und Privatpersonen. mehr Infos >>Excel-Rechnungsgenerator
Der „Rechnungsgenerator“ ist ein professionelles Excel-Tool zur einfachen, automatisierten Erstellung von Angeboten, Rechnungen und Lieferscheinen. Damit lassen sich rechtskonforme Rechnungen für in- und ausländische Unternehmens- oder Privatkunden... mehr Infos >>Weitere Excel-Vorlagen finden Sie hier >>
Rollierende Liquiditätsplanung auf Wochenbasis
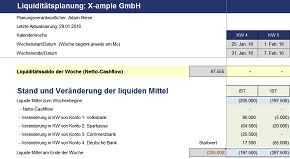
Dieses Excel-Tools bietet Ihnen die Grundlage für ein Frühwarnsystem. Der erstellte Liquiditätsplan warnt Sie vor bevorstehenden Zahlungsengpässen, so dass Sie frühzeitig individuelle Maßnahmen zur Liquiditätssicherung einleiten können. Gerade in Krisensituationen ist eine kurzfristige Aktualisierung und damit schnelle Handlungsfähigkeit überlebenswichtig.
Mehr Informationen >>
Excel-Finanzplan-Tool PRO für Kapitalgesellschaften
Dieses Excel-Tool ist ein umfangreiches - auch von Nicht-Betriebswirten schnell nutzbares - integriertes Planungstool, welches den Nutzer Schritt-für-Schritt durch alle Einzelplanungen (Absatz- und Umsatz-, Kosten-, Personal-, Investitionsplanung etc.) führt und daraus automatisch Plan-Liquidität (Cashflow), Plan-Bilanz und Plan-GuV-Übersichten für einen Zeitraum von bis zu 5 Jahren erstellt.Mehr Informationen >>
Vorlage - Formular für Investitionsplanung, Investitionsantrag
Dieses Excel-Tool bietet Ihnen Muster-Formulare für die Steuerung von Investitionen/ Anlagenbeschaffungen in einem Unternehmen. Es sind es sind Vorlagen zu Investitionsplanung und Investitionsantrag enthalten.
Mehr Informationen >>
Weitere über 400 Excel-Vorlagen finden Sie hier >>
Skript Kostenrechnung
Umfassendes Skript für Studenten, Auszubildende und angehende Bilanzbuchhalter zu allen prüfungsrelevanten Themen aus der Kosten- und Leistungsrechnung als ebook im pdf-Format. Auf 163 Seiten wird alles zum Thema Kostenrechnung ausführlich und verständlich sowie mit vielen Abbildungen und Beispielen erläutert.Themen:
- Kostentheorie
- Aufgaben und Systeme der Kostenrechnung
- Vollkostenrechnung
- Teilkostenrechnung (Deckungsbeitragsrechnung)
- Plankostenrechnung
- Kurzfristige Erfolgsrechnung
- Prozesskostenrechnung
- Kalkulation im Handel
Zusätzlich zum Skript erhalten Sie umfangreiche Klausuraufgaben und Übungsaufgaben mit Lösungen! Preis 9,90 EUR Hier bestellen >>
Excel TOP-SellerRS Liquiditätsplanung L

Die RS Liquiditätsplanung L ist ein in Excel erstelltes Werkzeug für die Liquiditätsplanung von Kleinunternehmen sowie Freiberuflern. Die Planung erfolgt auf Basis von veränderbaren Einnahmen- und Ausgabepositionen. Detailplanungen können auf extra Tabellenblättern für z.B. einzelne Projekte oder Produkte vorgenommen werden.
Mehr Informationen >>
Rollierende Liquiditätsplanung auf Wochenbasis
Dieses Excel-Tool bietet Ihnen die Grundlage für ein Frühwarnsystem. Der erstellte Liquiditätsplan warnt Sie vor bevorstehenden Zahlungsengpässen, so dass Sie frühzeitig individuelle Maßnahmen zur Liquiditätssicherung einleiten können. Gerade in Krisensituationen ist eine kurzfristige Aktualisierung und damit schnelle Handlungsfähigkeit überlebenswichtig. Mehr Informationen >>Strategie-Toolbox mit verschiedenen Excel-Vorlagen
Die Strategie-Toolbox enthält 10 nützliche Excel Vorlagen, die sich erfolgreich in der Strategie bewährt haben. Alle Tools sind sofort einsatzbereit und sind ohne Blattschutz. Damit können die Vorlagen individuell angepasst werden. Ideal für Mitarbeiter aus dem strategischen Management. Mehr Informationen>>
Weitere über 400 Excel-Vorlagen finden Sie hier >>
Premium-Mitgliedschaft
Erhalten Sie als StudentIn oder Auszubildene(r) Zugriff auf Premium-Inhalte von Controlling-Portal.de und Rechnungswesen-Portal.de zum Vorzugspreis von 39,- EUR für 2 Jahre. Aktuelle und ständig erweiterte Fachbeiträge, ausgewählte sonst kostenpflichtige Excel-Vorlagen. Verschaffen Sie sich hier einen Überblick über unsere Premium-Inhalte.Weitere Informationen zum Ausbildungspaket >>
